Mr. Electric provides a guide on energy expenses by state to show how electricity costs vary nationwide.
|
Your monthly electric bill reveal can be, well, shocking. Have you ever found yourself staring at your power bill, wondering what you could have done to keep your energy costs down? We've all been there, and while there are many ways to conserve electricity, it's important to note that the cost of energy can vary significantly depending on your location.
Today, we're shining a light (pun intended) on the differences between U.S. energy costs by state. To bring you the goods, we used data from the U.S. Energy Information Administration (EIA) to explore the peaks and valleys of electric expenses in every U.S. state.
So if you've ever wondered how your state's energy costs stack up against the rest, read on for the electrifying truth!
U.S. States with the Highest Monthly Electric Bills, Over Time

Â
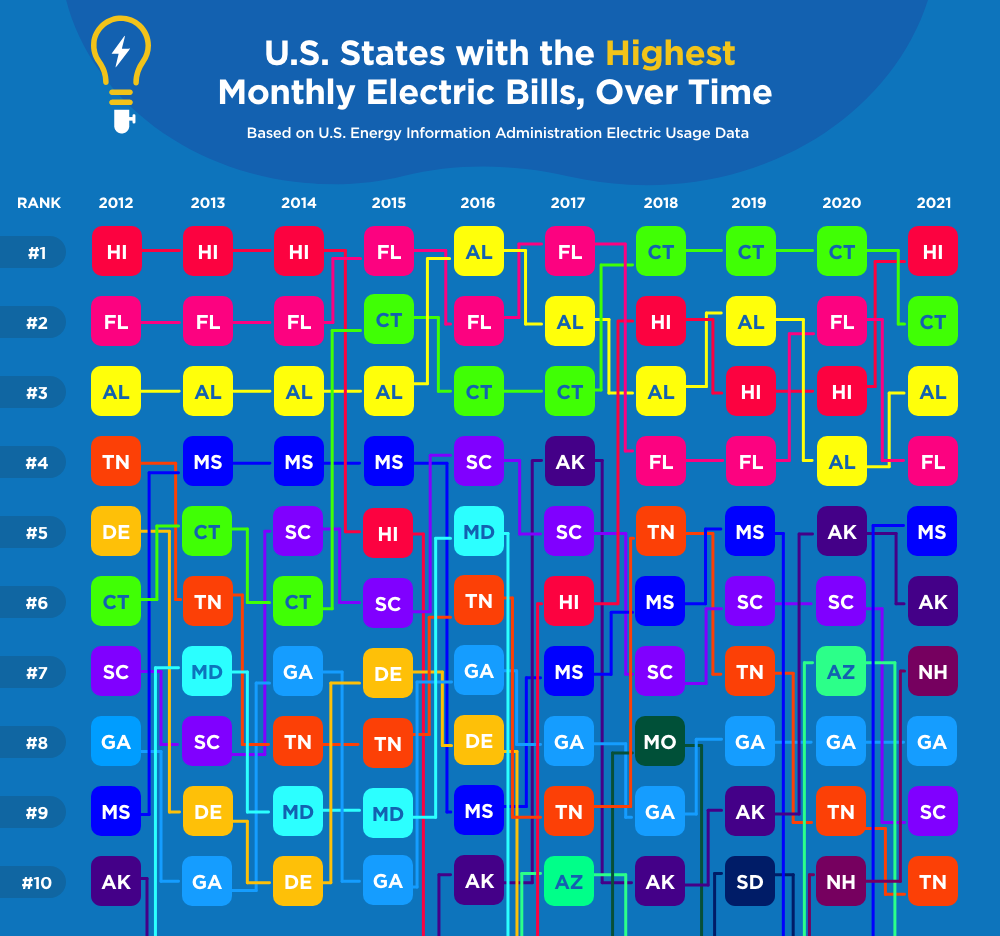
Beautiful Hawaii, the land of breathtaking beaches and jaw-dropping electric bills! As our graphic demonstrates, The Aloha State kicked off and ended the decade with the highest cost of energy of any U.S. state, making it the reigning king of kilowatt costs!
Meanwhile, New Hampshire managed to avoid the ranks of top-10 most expensive electric bill states for years, only to shoot up to 10th place in 2020. Unfortunately, New Hampshire ultimately ended the decade rising even higher on the list, finishing in the 7th place spot for 2021.
Any discussion of energy cost by state should give Delaware (the comeback kid of energy expenses) its due. The First State began the decade at #5 on our list but managed to escape the top 10 entirely by 2017. Now that's a powerful success story!
U.S. States with the Lowest Monthly Electric Bills, Over Time

Â
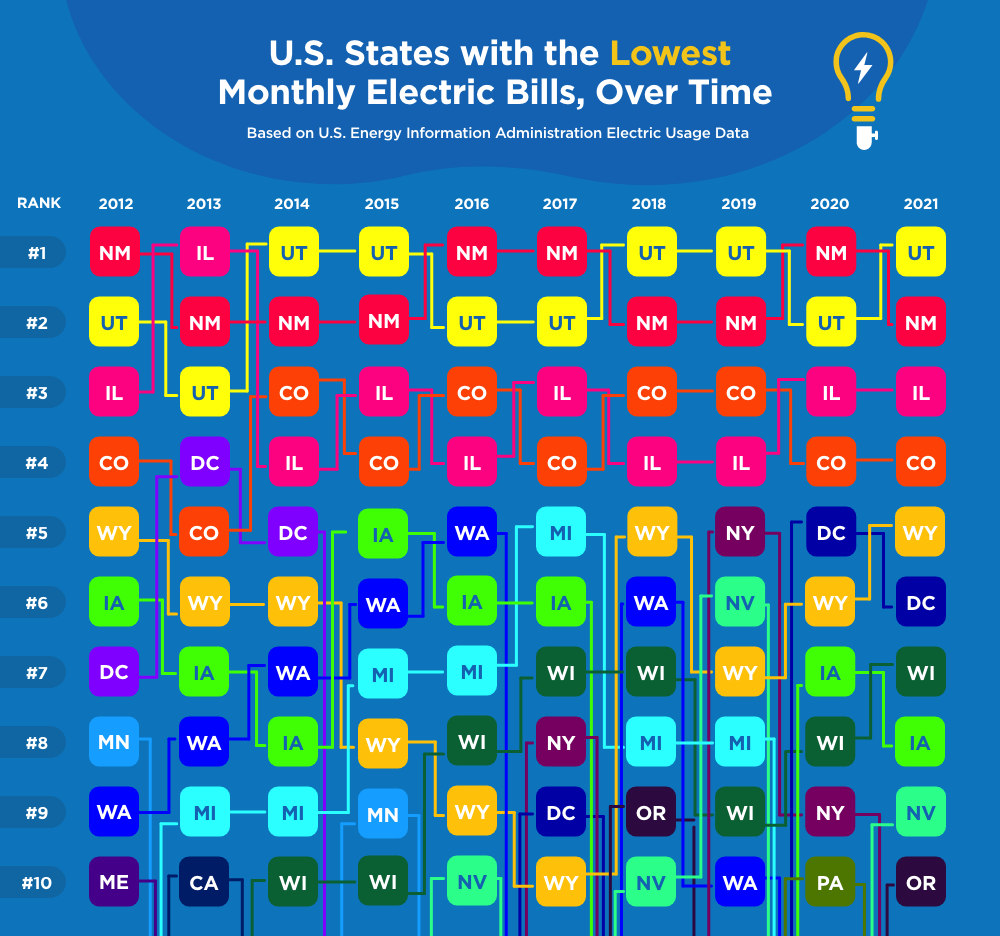
It was an epic decade-long fight between Utah, New Mexico, Illinois, and Colorado to claim the top spot on our list of states with the lowest electric bills over time. When the dust settled, Utah emerged victorious, closely followed by New Mexico, each boasting an average monthly electric bill of $69.09 and $69.34, respectively.
In an unexpected twist, The District of Columbia began the decade at #7 on the list, only to vanish from the top 10 by 2015. Then, just when we thought D.C. was out of the game, it made a spectacular comeback in 2017, finishing the decade strong at #6 for the lowest monthly electric bills.
America's Home Electric Spending: Changes Over a Decade, By State

Â
Next, let's dive into a decade of transformation as we explore America's home electric spending state by state. Some of the results are a bit of a jolt!
First up, Rhode Island takes the stage with the largest percent increase in monthly electric bills at an eye-popping +38.71%. The state began the decade with an average monthly electric bill cost of $79.97, only to skyrocket to $109.32 by the end.
On the flip side, Hawaii – the national leader in high electric bills – proved there's always a way to defuse high costs! With the best change for the better in monthly electric bills, Hawaii saw a 16% cost decrease. The state began the decade with an average monthly electric bill cost of about $173.34 and managed to get it down to $145.60 by the end.
Full Data
While we've shared some of our most high-voltage findings, our study got far more granular than we could include in this write-up. If you're itching to dig deeper, there's more data to explore! Check out our interactive data table below to see the energy cost by state across the decade. Search for your state in the heading or filter each column to sort the findings by that year, and be sure to check out the cost changes across the years.
Closing Thoughts
This completes our U.S.-wide circuit of home electric spending in each U.S. state. As we've explored the ups and downs of the cost of energy, we hope we've also sparked a deeper understanding of the power of place and how it impacts monthly electric bills.
As your trusted electric services provider, Mr. Electric is dedicated to helping you stay current on energy trends and find ways to optimize your electricity usage. For more insights, tips, and tricks to manage your energy costs or to browse our extensive services, be sure to visit our website. Also, don't miss our enlightening blog post on exactly how much money you can save by turning off lights.
Let's work together to make a bright and energy-efficient future a reality!
Methodology
To determine the amount of electric usage by household by state per month, we first collected all necessary data points from the U.S. Energy Information Administration for every year from 2012 to 2021. From there, we calculated the total per household kWh use by dividing total residential kWh sales by the number of households in that state based on the Census Bureau data for the given year. Next, we uncovered the cost per household by multiplying the total kWh used by the average retail price (cents/kWh). Finally, we divided that number by 12 to estimate the average monthly household electricity cost for every state each year from 2012 through 2021.
